
Increasing the fish productivity of ponds by the method of mixed stocking and polyculture
18 min read
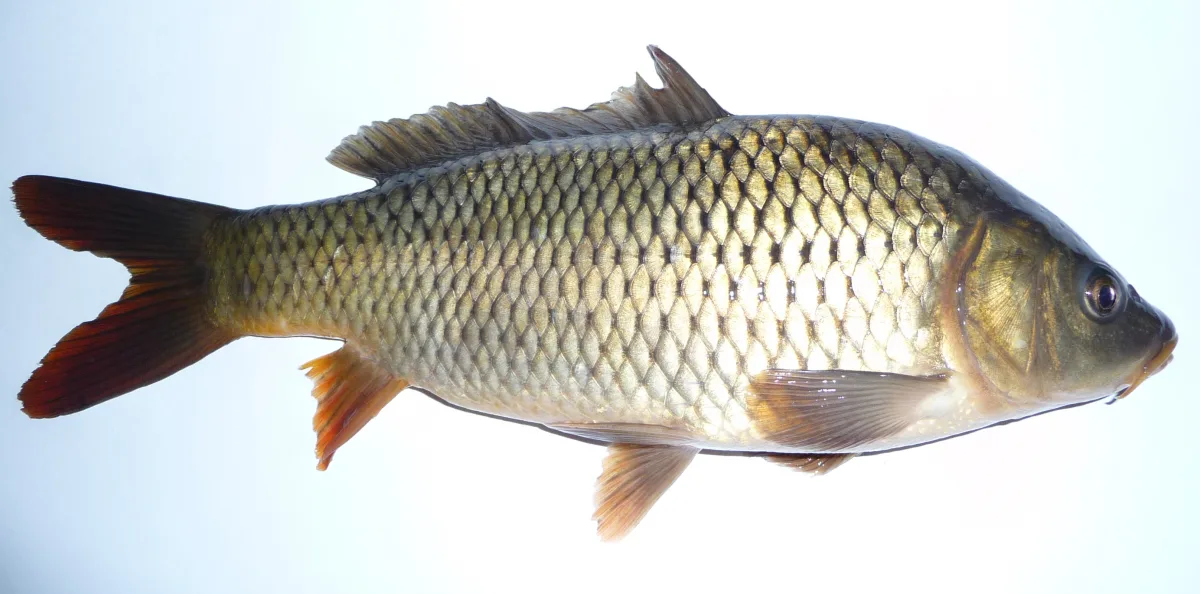
Mixed stocking and polyculture
To increase the natural productivity of a carp pond through more intensive use of the natural food base by fish without compromising the market quality of the fish being raised, carp farms employ mixed stocking and the stocking of supplementary fish species.
Mixed stocking refers to the stocking of carp of different ages into a single pond. The most common practice is stocking yearling carp along with fry in grow-out ponds. This combination is based on the differences in the diet of various age groups of carp. Juvenile carp primarily consume planktonic and vegetation-associated forms, while two-year-olds consume benthos.
Consequently, rearing two age groups in one pond allows for a more complete utilization of its food reserves. The ratio of carp age groups depends on the specific characteristics of the pond where they are being raised. A grow-out pond with a well-developed littoral zone can be stocked with more fry than a pond of the same area that is deeper with little underwater vegetation. Based on the experience of using mixed stocking in grow-out ponds, a ratio of yearlings to fry of 1:10 to 1:15 is recommended (i.e., for every one yearling, 10–15 fry).
Determine the increase in natural productivity of a grow-out pond (in %) with an area of 80 ha due to mixed stocking, given the following conditions:
- natural pond productivity is 220 kg/ha;
- average weight of yearling carp – 35 g;
- average weight of two-year-old carp – 500 g;
- survival rate of two-year-old carp – 85% of yearling stocking;
- mixed stocking is performed at a rate of 12 fry per 1 yearling;
- survival rate of fingerlings from the grow-out pond is 52% of the fry stocked;
- average weight of fingerlings in autumn – 35 g.
Calculate the number of yearling carp for stocking in the grow-out pond:
Calculate the number of carp fry for stocking in the grow-out pond:
Calculate the yield of carp fingerlings from the stocked fry:
Calculate the total mass of fingerlings reared in the grow-out ponds:
241200 × 0.035 = 8440 kg, or 106 kg per 1 ha of pond
Calculate the increase in productivity of the grow-out pond due to mixed stocking:
220 kg/ha – 100 % X = 48 %
Task. Determine the increase in natural productivity of a grow-out pond (%) with an area of _ ha due to mixed stocking, under the following conditions (according to the variant, table 9)
The stocking of supplementary fish in carp ponds pursues the same goals as mixed stocking. The use of a single pond to raise several fish species is based on the different feeding habits of the cultivated species. This makes it possible to increase the yield per unit area through more complete utilization of the pond's natural food resources and to expand the range of market products with relatively small additional costs.
Most often, Prussian carp is raised together with common carp, as it feeds significantly on zooplankton. It also consumes blue-green algae, detritus, and benthic forms.
Due to the stocking of yearlings of Prussian carp into carp grow-out ponds, the productivity of the ponds increases by 20-50% compared to the productivity of carp monoculture. The Prussian carp is a relatively fast-growing fish: in the first year, it reaches 15-20 g, in the second – 150-200 g, and three-year-old carp reach a weight of 350-400 g.
Tench can also be raised together with carp. The increase in productivity in this case is ensured by the carp and tench using different biotopes: tench primarily use the biocenoses of dense vegetation with silted bottoms, while carp prefer the open parts of the pond.
In the second year of life, tench reach 80-120 g, with a loss of 2.5-5% of the stocked yearlings, and productivity increases by approximately 20% due to the stocking of yearling tench without reducing the individual growth of the carp. In the third year of life, the average weight of tench is 200-300 g, with a loss of 2-5%, and productivity increases by 13-15%.
Calculate the stocking rate of Prussian carp in a carp grow-out pond with an area of 70 ha under the following conditions:
−weight of yearling Prussian carp at stocking – 17 g;
−weight of two-year-old Prussian carp in autumn – 210 g;
−survival rate of two-year-olds from grow-out ponds – 90% of yearling stocking;
−natural carp productivity of the pond – 215 kg/ha;
−increase in productivity due to the additional stocking of Prussian carp – 52% of carp productivity.
1. Calculate the gain per 1 ha of pond due to the additional stocking of Prussian carp:
2. Calculate the gain due to the additional stocking of Prussian carp from the entire pond area, ha:
109 /ha × 70 ha = 7300 kg
3. Calculate the Prussian carp gain per season:
4. Calculate the yield of two-year-old Prussian carp from the entire pond area:
7300 kg: 0.193 kg = 37800.
This calculation can be summarized by the following formula:
n – increase in productivity due to the stocking of supplementary fish,
B – mass of crucian carp at the end of the period (two-year-old);
b – mass of crucian carp at the beginning of the period (young-of-the-year);
Calculate the stocking rate of silver crucian carp for a fattening carp pond with an area of ha under the following conditions (according to the variant, table 9).
The yield from fish-breeding ponds can be significantly increased by co-culturing herbivorous fish with carp.
The importance of different species of herbivorous fish in polyculture is determined mainly by their feeding habits.
Grass carp feeds on higher aquatic vegetation. Its stocks in well-prepared ponds are small. Therefore, in polyculture, the grass carp is assigned the role of an effective biological land reclamation agent. In water bodies with heavy aquatic vegetation overgrowth, the importance of grass carp in polyculture increases.
Silver carp feeds on microscopic algae and detritus. It does not enter into direct food competition with other fish species. Moreover, co-culturing silver carp with carp has a positive effect on both species: growth is improved, and productivity increases.
This is explained by the fact that the algae consumed by the silver carp, having passed through its digestive tract and being partially processed, enter the bottom of the water body in the form of excrement. Carp readily consumes this excrement, which contains a significant amount of nutrients.
Thus, the algae become accessible to the carp. In turn, the carp stirs up the silt while searching for food, lifting detritus into the near-bottom layers, which is then consumed by the silver carp.
Table 9 – Indicators of pond farming for the calculation of mixed stocking
1 2 3 4 5 6 7 8 9 Pond area, ha
30 40 50 60 70 80 90 100 110 Natural fish productivity,
200 200 202 202 202 203 203 204 204 kg/ha Average mass of yearling carp, g 30 30 33 33 33 34 34 34 34 Average mass of two-year-old carp, g
480 485 485 490 490 490 495 495 495 Yield of two-year-old carp, percentage of
85 85 85 85 85 85 85 85 85 yearling stocking Mixed stocking is produced from
10 10 11 11 11 12 12 13 13 calculation, fry per yearling Yield of young-of-the-year from a fattening pond,
48 49 50 51 52 53 54 55 56 percentage of fry stocking Average mass of young-of-the-year in autumn, g 25 26 27 28 29 30 31 32 33
10 11 12 13 14 15 16 17 18 Pond area, ha 25 35 45 55 65 75 85 95 105 Natural fish productivity,
211 211 211 211 215 215 215 215 215 kg/ha Average mass of yearling carp, g 30 30 33 33 33 34 34 34 34 Average mass of two-year-old carp, g 480 485 485 490 490 490 495 495 495 Yield of two-year-old carp, percentage of
87 87 87 87 87 87 87 87 87 yearling stocking Mixed stocking is produced from
10 10 11 11 11 12 12 13 13 calculation, fry per yearling Yield of young-of-the-year from a fattening pond,
48 49 50 51 52 53 54 55 56 percentage of fry stocking Average mass of young-of-the-year in autumn, g 25 26 27 28 29 30 31 32 33
19 20 21 22 23 24 25 26 27 Pond area, ha 28 29 30 31 32 33 34 35 36 Natural fish productivity, kg/ha 220 225 225 226 257 228 229 201 202
Average mass of yearling carp, g 35 36 34 33 32 31 30 29 28 Average mass of two-year-old carp, g 480 485 485 490 490 490 495 495 495 Yield of two-year-old carp, percentage of
83 83 83 83 83 83 83 83 83 yearling stocking Mixed stocking is produced from
10 10 11 11 11 12 12 13 13 calculation, fry per yearling Yield of young-of-the-year from fattening pond,
53 54 55 56 57 58 59 50 51 percentage of fry stocking Average mass of young-of-the-year in autumn, g 25 26 27 28 29 30 31 32 33
Table 9 – Indicators of pond farming for the calculation of the quantity of silver
1 2 3 4 5 6 7 8 9 Pond area, ha 40 50 60 70 80 90 100 100 110 Mass of silver
15 16 17 18 19 20 21 22 23 crucian carp at stocking, g Mass of two-year-old silver 18 20
180 190 195 200 210 220 230 crucian carp in autumn, g 5 5 Yield of two-year-old from fattening ponds, percentage of yearling 85 86 87 88 89 90 90 91 91 stocking Natural fish productivity 18 18
180 182 183 184 186 187 188 of pond by carp, ha 1 5 Increase in fish productivity due to additional stocking, 50 50 50 50 50 50 50 50 50 %
10 11 12 13 14 15 16 17 18 Pond area, ha 35 45 55 65 75 85 95 105 30 Mass of silver
24 25 26 27 28 29 30 31 32 crucian carp at stocking, g Mass of two-year-old silver 18 20
180 190 195 200 210 220 230 crucian carp in autumn, g 5 5 Yield of two-year-old from fattening ponds, percentage of yearling 80 80 80 80 80 80 80 80 80 stocking Natural fish productivity 19 20
190 194 196 198 202 204 206 of pond by carp, ha 2 0 Increase in fish productivity due to additional stocking, 45 45 45 45 45 45 45 45 45 %
19 20 21 22 23 24 25 26 27 Pond area, ha 28 29 30 31 32 33 34 35 36 Mass of silver
24 25 24 25 25 25 26 27 29 crucian carp at stocking, g Mass of two-year-old silver 18 20
180 190 195 200 210 220 230 crucian carp in autumn, g 5 5 Yield of two-year-old from fattening ponds, percentage of yearling 81 82 83 84 79 80 84 84 85 stocking Natural fish productivity 20 21
206 210 212 214 218 220 222 of pond by carp, ha 8 6 Increase in fish productivity due to additional stocking, 40 40 40 40 40 40 40 40 40 %
The mutual positive influence of silver carp and carp is observed at different stocking densities of both species.
Bighead carp is only a partially herbivorous fish. Its main food is zooplankton; in case of its deficiency, a significant proportion of its diet consists of phytoplankton and detritus. A high growth rate is observed when there is at least 3–4 mg/l of zooplankton in the water body. An excessively dense stocking of bighead carp can cause competition with carp for zooplankton consumption and a decrease in the growth intensity of both fish species.
Co-culturing silver carp with bighead carp negatively affects the growth of the latter. This is explained by the deterioration of conditions for the development of small forms of zooplankton as a result of the intensive consumption of algae by the silver carp.
The polyculture object can also be the black carp, which feeds on mollusks and organisms found on the bottom of the water body. In polyculture, it, like the grass carp, performs the role of a biological land reclamation agent, destroying intermediate hosts of certain parasites. In water bodies with significant development of mollusks, black carp can provide good productivity.
Herbivorous fish do not exhaust the list of species promising for polyculture in water bodies.
Using predatory fish to protect the carp forage base
Integrated farming of carp with predatory fish species — pike, zander, and rainbow trout — allows for a significant increase in the overall fish productivity of grow-out ponds. Predators actively consume large invertebrates that compete with non-predatory fish for food. By destroying dragonfly larvae, water bugs, mites, as well as tadpoles, frogs, and weed fish, predatory fish preserve valuable food resources for carp. As a result, the growth of non-predatory fish and the overall productivity of the water body increase significantly.
In practice, predatory fish fingerlings are stocked into grow-out ponds alongside carp yearlings. This approach allows for the use of the water body's food resources with maximum efficiency. However, this technological method requires strict control over the type and hydrodynamics of the water body.
Supplemental stocking of predatory fish fingerlings is permitted exclusively in fully drainable ponds. Releasing predators into non-drainable water bodies is strictly prohibited.
Integration of fish farming with duck farming: rules for joint management
The organization of integrated carp-duck farms allows for the production of carp as the main product and duck meat as an additional one. Ducks act as natural land improvers in the pond: they consume hard aquatic vegetation and loosen the bottom in shallow areas, preventing overgrowth. Furthermore, the birds actively destroy fish pests and food competitors of carp — mollusks, dragonfly and mayfly larvae, water beetles, bugs, tadpoles, and small frogs. The reduction in the population of these organisms occurs both through their consumption by ducks and due to the destruction of the thickets where they reside.
Duck manure serves as a valuable organic fertilizer, stimulating the development of zooplankton and chironomid mosquito larvae — a favorite food for carp. Joint keeping also improves the health of the stock: ducks catch sick and weakened carp, while healthy fish remain out of their reach. The natural mortality of carp in such farms usually does not exceed the established regulatory indicators.
| Duck manure component | Content, % |
|---|---|
| Organic matter | 26,2 |
| Nitrogen | 10,0 |
| Phosphoric acid | 1,4 |
| Potassium | 0,62 |
| Calcium | 1,7 |
| Magnesium | 0,35 |
Birds also serve as a biological means of controlling low-value weed fish, for example, stunted crucian carp, which often overpopulate non-drainable ponds. To achieve this effect, release ducks onto the water before the weed fish spawning begins and keep them there throughout the entire growing season. With the proper organization of an integrated farm, pond productivity increases sharply. A significant effect is provided by feeding livestock even in water bodies devoid of submerged and emergent vegetation.
- Increase in fish yield with duck grazing — by 40%
- Growth in productivity of lowland peat quarries — by 35%
- Stocking density of poultry in peat quarries — 100 heads/ha
The stocking density of poultry depends directly on the flow, depth, volume of vegetation, and hydrochemical regime of the water body. Exceeding the recommended rates leads to accelerated depletion of the forage base and an increased risk of duck infection with helminths, whose intermediate hosts are daphnia, cyclops, gammarus, and other organisms. For most standard ponds, the following stocking rates have been established:
| Water body type | Stocking rate, heads per 1 ha |
|---|---|
| Standing water bodies (depth up to 1 m) | 200–250 |
| Flowing water bodies | 500–600 |
In non-flowing water bodies where water levels drop in summer, as well as in ponds with high oxidizability, the duck stocking density should be significantly lower. Excessive concentration of birds per unit area leads to water pollution with manure and creates conditions for the emergence of epizootics, primarily branchiomycosis. To prevent disease outbreaks, it is necessary to strictly comply with biosecurity rules.
Biosecurity rules in carp-duck farms:
- Duck grazing is permitted only in grow-out ponds where no cases of carp rubella or gill rot are observed.
- Grazing of ducks is prohibited in spawning, fry, nursery, and overwintering ponds due to the risk of eating eggs, small fish, and rapid water pollution.
- The presence of ducks in headwater ponds is unacceptable — spores of the fungus causing gill rot can be spread throughout the farm system with the water.
- Do not allow runoff from livestock buildings into fish ponds. An increase in the oxidizability of unfiltered water above 20 mg O₂ per L creates conditions for an outbreak of branchiomycosis.
In this regard, it is important to ensure an even distribution of birds across the entire area of the pond. Duck feeders must be placed along the shoreline, as feeding in one location keeps ducks in a relatively limited area, and even when adhering to the correct stocking rates, these areas will become polluted, which will create conditions for the emergence of gill rot.
For grazing in fish ponds, 20–25-day-old ducklings of a fast-growing meat breed are used, for example, Peking ducklings. At the age of 60–70 days, they reach slaughter weight (about 2 kg). Ducks should not be kept longer: they begin to molt, and the meat quality decreases. After the slaughter of the first batch of ducks, a second batch is released for grazing, which manages to reach slaughter weight by autumn.
When using ducks, certain requirements must be followed:
- During the fish stocking of ponds and during autumn harvesting, ducks are not allowed to graze on them. This is because during spring stocking, when fish are weakened after overwintering, they stay near the banks for the first period, and ducks can destroy them.
- During the autumn harvesting of ponds, ducks stir up the water significantly, thereby interfering with the harvesting and simultaneously injuring the fish.
- To avoid ducks eating the feed provided for the fish, fish feeding stations should be located in deeper areas, or fenced off in shallow ones.
Thus, the organization of carp-duck farms allows for more complete utilization of the pond water area and the production of both fish and duck meat.
Due to the fact that grazing ducks on carp fattening ponds increases the natural productivity of the ponds by an average of 40%, this should be taken into account when determining the number of yearlings for stocking in fattening ponds. Duck stocking is calculated based on the pond area with a depth of up to one meter, and this area yields a higher natural productivity.
How to calculate the stocking of ducks and carp yearlings for the entire pond area is shown in the following example. It is required to determine the number of ducks and carp yearlings for stocking in a fattening pond with an area of 100 ha under the following conditions:
| Natural pond productivity | 200 kg/ha |
| Average weight of yearlings at stocking | 30 g |
| Output of two-year-olds from fattening ponds | 85% of yearling stocking |
| Pond area with a depth of up to one meter | 50 ha |
| Duck stocking rate | 200 heads per ha |
We determine the number of ducks for stocking in a fattening carp pond with a depth of up to 1 m.
We determine the stocking of carp yearlings in a fattening pond without taking into account the increase in productivity due to duck grazing, where V is the carp mass at the end of the period (two-year-olds), v is the carp mass at the beginning of the period (fingerlings).
We determine the increase in productivity due to duck grazing.
We determine the additional stocking of carp yearlings due to the increase in productivity.
We determine the total stocking of carp yearlings in fattening ponds, taking into account duck grazing.
This calculation can be expressed as the following formula, where X is the number of yearlings required for stocking in a fattening pond considering duck grazing; G1 is the pond area with a depth of up to one meter, ha; 0.4 is the 40% increase in productivity due to ducks; V is the carp mass at the end of the period (two-year-olds); v is the carp mass at the beginning of the period (fingerlings).
Table 10 – Pond farming indicators for calculating carp and duck quantities
1 2 3 4 5 6 7 8 9 Pond area, ha 100 110 120 130 140 150 160 170 180 Natural productivity, kg/ha 180 182 184 186 188 189 190 192 193 Average weight of yearlings at stocking, g 30 30 30 30 30 30 30 30 30 Planned weight of two-year-olds, g 480 480 480 480 480 480 480 480 480 Output of two-year-olds from fattening ponds
85 85 84 84 86 86 86 85 87 – percentage of yearling stocking Pond area with a depth of up to 1 m, ha 80 90 95 100 111 13 120 145 150 Increase in productivity due to
40 40 40 41 41 41 42 42 42 duck grazing, % Duck stocking rate, heads/ha 200 200 200 200 200 200 200 200 200
10 11 12 13 14 15 16 17 18 Pond area, ha 85 66 77 46 23 24 25 26 27 Natural productivity, kg/ha 180 182 184 186 188 189 190 192 193 Average weight of yearlings at stocking, g 30 30 30 30 30 30 30 30 30 Planned weight of two-year-olds, g 500 500 500 500 500 500 500 500 500 Output of two-year-olds from fattening ponds
85 85 84 84 86 86 86 85 87 – percentage of yearling stocking Pond area with a depth of up to 1 m, ha 17 18 19 20 21 22 23 24 25 Increase in productivity due to duck grazing, % 35 35 36 36 36 35 36 35 36
19 20 21 22 23 24 25 26 27 Pond area, ha 80 70 60 31 45 33 95 35 36 Natural productivity, kg/ha 200 200 205 206 207 210 215 215 215 Average weight of yearlings at stocking, g 30 30 30 30 30 30 30 30 30 Planned weight of two-year-olds, g 510 510 510 510 510 510 510 510 510 Output of two-year-olds from fattening ponds
Read next
Fish farming For students
Technological standards for rearing and maintaining carp in pond farms
Fish farming For students
Features of carp breeding in pond farms of fish-farming zones of Russia
Fish farming For students