
Methods and principles for determining the mineral fertilizer requirements of crops
12 min read
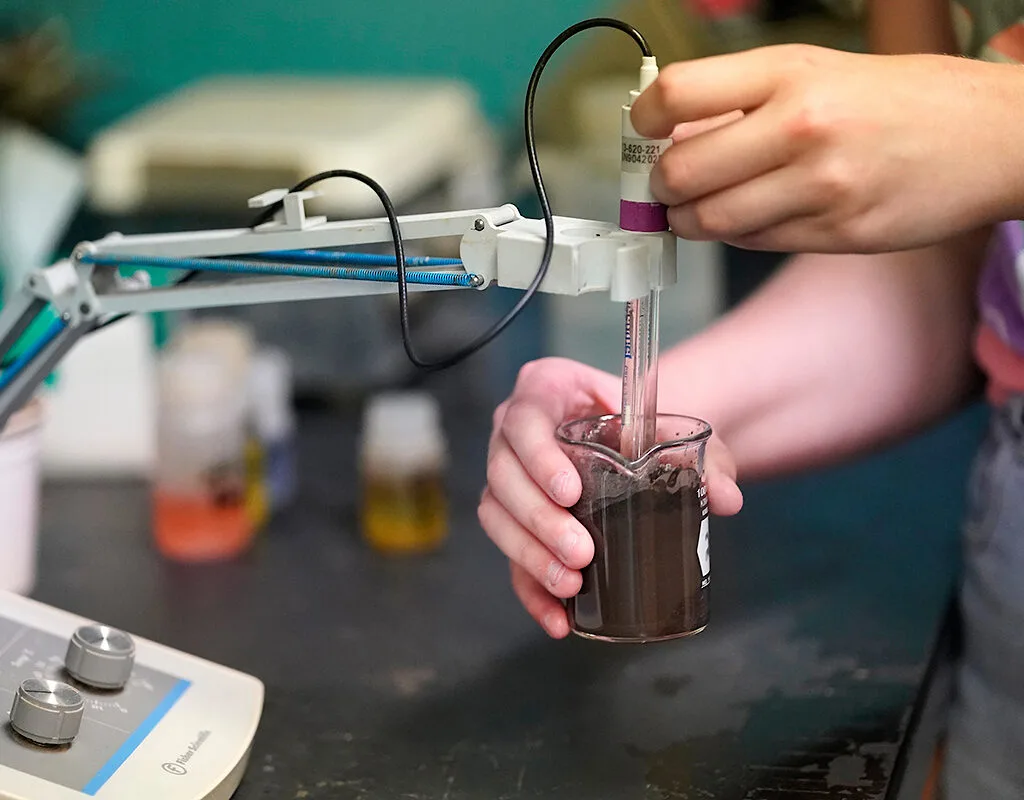
Rational fertilizer application is impossible without monitoring plant nutrition at all stages of yield formation. For top dressing to cover costs and generate profit, it is necessary to calculate nutrient doses as accurately as possible. Fertilizer requirement is the difference between the amount of nutrients a crop needs for a planned yield and the amount already available in the soil.
Calculation of requirement: economic and biological uptake
The formula used for calculation is: R = N – S, where R is the fertilizer requirement, N is the amount of elements required by the plant, and S is the nutrient content in the soil. Under ideal conditions, where the soil fully provides for the crop (S = N), the requirement is zero. If the soil contains no available elements (S = 0), the entire requirement is covered by fertilizers. In practice, agronomists work with various intermediate ratios of these parameters.
Plant requirement is characterized by their uptake — the quantity of nutrients contained in the harvest from 1 ha (in kilograms or grams). Two types of uptake are used for calculations: economic and biological. They serve different purposes when planning a nutrition system.
Economic uptake is used to calculate the nutrient balance in the soil and fertilizer application rates. Biological uptake shows the maximum nutrient requirement of plants, which usually occurs at the onset of maturation.
Economic uptake takes into account the content of elements in the part of the harvest that is removed from the field. Biological uptake shows the total amount of elements in above-ground and underground organs, including substances leached from leaves or excreted through roots. To determine the current nutritional requirement of crops, plant (visual and chemical) and soil diagnostics are conducted.
Visual diagnostics: how to recognize nitrogen and phosphorus deficiency
Visual diagnostics is a quick way to assess the condition of crops in the field. During visual inspection, an agronomist checks plant height, the degree of tillering or branching, as well as leaf size and shape. Special attention is paid to color: the overall crop color is assessed, as well as the difference between upper and lower leaves, the appearance of spots, and the color of dried tissue.
Do not confuse signs of starvation with diseases or climatic stress. Lower leaves may turn yellow due to drought or shading. With nutrient deficiency, spots are localized along the leaf edges or veins and appear in a specific area of the field, while in case of diseases, they are scattered randomly across individual plants.
Nitrogen deficiency. Plants remain stunted, tiller poorly, and form small leaves. The overall crop color pales, turning light green, yellowish-green, or yellow, with the yellowing being more pronounced on lower leaves. Leaf edges lighten, then take on a beige color and dry out, becoming light brown. Symptoms gradually spread from the bottom up the plant.
In soybean, nitrogen deficiency is more evident on leaves formed specifically during the starvation period. In crops with parallel venation (wheat, corn), the leaf tip dries out more severely, while with reticulate venation (beet, soybean) dieback occurs evenly along the entire edge. Signs of nitrogen deficiency often appear in the spring.
- Nitrogen deficiency in winter wheat — stem elongation phase
- Nitrogen deficiency in corn — 6–7 leaf stage
- Phosphorus deficiency in winter wheat — tillering phase
Phosphorus deficiency. Crops lag in growth, tiller poorly, and form narrow, small, and upright leaves. Crops acquire a dark green color, sometimes with a brown tint. Brown spots appear on the lower leaves, which merge and cause the edges to dry out; the dead tissue becomes dark brown or dark chestnut. With parallel venation, the leaf tip dries out, while with reticulate, the entire edge does. Phosphorus starvation is often observed in carbonate soils.
Visual diagnostics: identifying element deficiency by symptoms
Visual assessment helps to quickly notice nutrition problems right in the field. Characteristic symptoms allow one to assume exactly which element the plants are lacking at a given moment. However, for an accurate diagnosis, it is necessary to compare the appearance of the crops with the soil type and treatment history.
- Potassium. Plant growth is weakened, tillering and branching are poorly expressed. The general color of the leaves remains green, but the tips and edges of the lower leaves lighten, then dry out and turn brown. Symptoms spread from the bottom up the plant. In field conditions, such deficiency is rare.
- Calcium. The growth of upper leaves is delayed, light yellow chlorotic spots appear on them, after which they die off. Older leaves retain a normal appearance because calcium is poorly reutilized. Roots shorten, branch poorly, and become slimy. Calcium starvation is characteristic of acidic sod-podzolic soils.
- Magnesium. The chlorophyll content in tissues decreases. On leaves (primarily the lower ones, as magnesium is reutilized), "marble" spotting appears: they pale between the veins, but the green color is retained along the veins. Then the leaves turn yellow, curl from the edges, and fall off prematurely. Deficiency is rare, mainly in soils with low magnesium content.
- Sulfur. Upper young leaves and their veins take on a light green or yellow color, and later the older leaves turn yellow as well. Symptoms are similar to nitrogen starvation but are more pronounced on the upper canopy.
- Boron. Tips and young leaves lighten, growing points die off, and seed yield decreases. In beet, young leaf buds and the growing point die off (heart rot), and in tomatoes, growing points blacken. The problem occurs more often in carbonate soils, and on sod-podzolic soils — after liming.
- Molybdenum. Due to disrupted nitrogen metabolism, the green color of leaves weakens. In grain legumes, the color of the entire leaf changes; in other plants, light spots appear. In case of severe deficiency, chlorotic tissues die off, and leaves become distorted.
- Manganese. Interveinal chlorosis develops: leaves pale or turn yellow, but the veins remain green, creating a mottled appearance. Later, chlorotic tissue dies off, forming spots. On leaves with reticulate venation, these spots are round; with parallel — elongated. Deficiency is more common in beet, potato, cabbage, and fruit crops on carbonate and peat soils.
- Copper. Manifests as leaf chlorosis, whitening and drying of their tips, and wilting. In cereals, tillering is delayed, and seeds form poorly. Symptoms are more pronounced on young parts of plants. The problem is characteristic of peat, acidic, and sandy soils.
- Zinc. Causes chlorosis of the upper leaves, which is especially noticeable in young corn. Plant growth is weakened, and cobs form small and distorted. Deficiency manifests on carbonate and other soils, often provoked by phosphate fertilizer application.
- Iron. Young leaves lose their green color. Most often, plants experience this type of starvation on carbonate soils in arid zones.
Signs of sulfur deficiency are easily confused with nitrogen starvation. The difference is that sulfur deficiency is more pronounced in the upper young leaves. The exception is soybean: in this crop, nitrogen deficiency can also manifest on the tips. For this crop, sulfur deficiency can only be identified through chemical analysis of the leaves.
Since chlorosis develops due to a lack of various elements, it is often difficult to make an accurate visual diagnosis. Test your hypothesis locally: apply a top dressing to a small plot with a solution of fertilizer containing the missing element. If the diagnosis is correct, the signs of starvation will disappear in a few days.
Chemical analysis and rapid field diagnostics
The chemical composition of plants is directly related to their yield and nutritional conditions. Accurate diagnosis of crop nutrient requirements is based on this relationship. With optimal nutrition, plants form a high harvest, and their chemical composition is taken as the target norm. If productivity is low and the concentration of elements in the tissues is small, the crop requires top dressing. In cases where young plants are oversaturated with nutrients but do not gain mass, growth retardation is caused by other limiting factors.
To control nutrition during the growing season, tissue or leaf diagnostic methods are used. Tissue analysis assesses the content of inorganic forms of elements in cell sap or plant extract. Such an assessment can be carried out directly in the field using a portable rapid laboratory. This method allows for the determination of nitrogen, phosphorus, and potassium levels in just a few minutes, enabling prompt decisions regarding the necessity of top dressing.
For analysis, the following are sampled: for potatoes, the petioles of leaves from the middle tier; for corn, the central vein at the base of the leaf from the middle tier; for wheat, the lower part of the plants, stripped of leaf blades. The sap is extracted with a manual press and placed drop by drop into the depressions of a special plate. Then, corresponding reagents are added dropwise, and the resulting color is compared with a scale of reference solutions or a paper color scale. Such analyses provide a wealth of information. For example, in one experiment analyzing the cell sap of winter wheat at the tillering stage, the following results were obtained (Table 173; Kurkaev V.T., 2000).
The results show that without fertilizer on this plot, the plants suffered from nitrogen deficiency and should have been top-dressed with nitrogen fertilizer. The application of high-rate nitrogen alone led to phosphorus starvation, while phosphorus alone led to an acute nitrogen deficiency (there is no nitrogen in the cell sap, and phosphorus accumulates as it does not convert into organic compounds). In the final variant, the composition of the cell sap indicates optimal nutritional conditions.
The V.V. Tserling field laboratory can also be used. It allows for the determination of nitrate, phosphate, and potassium content in plants. The analysis is performed on cross-sections of plant parts rich in the vascular-conducting system. For comparison, samples must be taken from the same tier of plants, preferably the middle one. Appropriate reagents are applied to the sections. The assessment of the plant nutrition status is based on the color. The darker the color, the higher the nutrient content and the lower the need for fertilizer.
A number of other methods are also used. Since nitrogen deficiency is the most common, tissue diagnostics of nitrogen nutrition in the field can be conducted using a diphenylamine solution (according to V.V. Tserling). Analysis of extracts from plant tissues (according to K.P. Magnitsky) also yields good results.
Leaf diagnostics consist of analyzing leaves for the total content of mineral nutrition elements, which allows for the assessment of plant nutrient availability. The chemical composition of plants in the surveyed plot is compared with that of adequately nourished plants.
For analysis, leaves from a specific tier are selected, most often the middle one, sometimes the top mature leaf (the third from the top, starting from the unfolding leaf).
Procedure for material preparation:
- Dry the collected leaves;
- Grind the plant mass;
- Determine the content of nitrogen, phosphorus, and potassium using rapid total analysis methods (one of the methodologies is provided in the appendix).
For example, regarding the conditions of the Krasnodar Territory, a leaf diagnostic methodology has been developed to establish the nitrogen rate for late nitrogen top dressing of winter wheat with the aim of improving grain quality. The analysis is conducted on the three top leaves. Fertilizer rates are determined based on the nitrogen content.
Soil diagnostics refers to determining the content of available forms of nutrients—nitrogen, phosphorus, potassium, and microelements—in the soil. The results of soil diagnostics are used to establish rates for the base fertilizer and top dressings.
To determine the conditions of nitrogen nutrition of plants in the soil, the content of nitrate and ammonium nitrogen is determined. These forms of nitrogen are directly assimilated by plants. Together, they constitute mineral nitrogen.
When evaluating the results of the determination, it is necessary to consider that soil analysis in crops determines the residue of mineral nitrogen remaining after plant consumption. Therefore, the results can only be evaluated alongside observations of plant growth, as the mineral nitrogen formed is rapidly absorbed by plants. If mineral nitrogen in the soil is low, but plants are growing normally, then applying fertilizer during the growing season is not necessary.
Determination of mineral nitrogen in the soil is also possible in autumn, especially in regions where the soil freezes for a long period. To assess the soil nutrient status, the content of easily hydrolyzable forms of nitrogen is also determined in acidic or alkaline extracts.
To assess the phosphorus supply of plants, the content of this element in the soil, which passes into various acidic or salt extracts, is determined.
Table 174 – Acidic and salt extracts used for determining mobile phosphorus content Soil Method Solvent
Sod-podzolic Kirsanov 0.2n НСl Leached chernozem Chirikov 0.5n СН3СООН Ordinary chernozem Machigin 1 %(NH4)2 CО3 Red soil and yellow soil Arrhenius 1 % citric acid
Soil potassium status is assessed based on the results of determining exchangeable potassium in the same extract as phosphorus. The obtained results are grouped and plotted on agrochemical cartograms.
Table 175 – Grouping of soils by mobile phosphorus and exchangeable potassium content, mg/kg of soil
Group Mobile phosphorus Exchangeable potassium Content by Machigin by Chirikov by Machigin by Chirikov 1 Very low <10 <50 <100 0-30 2 Low 10-15 50-100 100-200 31-60 3 Medium 15-30 100-150 200-300 61-90 4 Increased 30-45 150-200 300-400 91-120 5 High 45-60 200-300 400-600 121-180 6 Very high >60 >300 >600 >180
Mobile forms of microelements are determined in various extracts, and the results are also plotted on cartograms.
Determining application rates of mineral fertilizers is one of the most important and difficult tasks in their use.
Numerous experiments have established that the greatest increase per unit of fertilizer spent is obtained when applying low application rates. However, in this case, the yield increase per unit area is lower. With an increase in fertilizer rates, the increase per unit area grows up to a certain limit, but the production gain per unit of fertilizer spent decreases. At very high fertilizer rates, yield increases do not cover the costs of their application.
It is economically more profitable to apply lower fertilizer rates over a larger area and obtain a higher total harvest than to use high fertilizer rates on a smaller area.
Various methods are used to calculate fertilizer rates.
use of field experiment results and agrochemical cartograms
Field experiment method. The yield value is an integral indicator caused by the influence of a complex combination of factors. Therefore, the results of field experiments with fertilizers are the most reliable way to establish their application rates. Fertilizer rates are set based on the results of long-term field experiments conducted with different crops on specific types and subtypes of soil under comparable conditions (agricultural practices, weather conditions). Such experiments are mainly carried out by scientific institutions and are refined under production conditions. The method is quite accurate but does not allow for taking into account the soil fertility of individual fields.
Field experiment and agrochemical cartogram method. Along with field experiment data, agrochemical soil analyses are used. This method is the primary one. Farms periodically carry out agrochemical soil surveys, the results of which are used to compile agrochemical cartograms of mobile phosphorus, exchangeable potassium, acidity, etc. Depending on the soil nutrient status of individual fields, adjustments are made to the average rates recommended by research institutions (taken as a unit). In case of low soil nutrient status, fertilizer rates are increased; in case of high status, they are decreased (Table 176; Achkanov A.Ya., Khomutov Yu.V., Eysert E.K., 1987).
If the fertilizer requirement is expressed by small application rates, nitrogen fertilizers are applied as top dressing, phosphorus fertilizers are applied in rows during sowing, and potassium fertilizers are not applied.
Read next
Nutrition and fertilizers For gardeners
Signs and causes of phosphorus deficiency in crops
Nutrition and fertilizers For gardeners
Diagnostics and symptoms of potassium deficiency in crops
Agrochemistry For students