
Methodology for assessing the responsiveness of crops to mineral fertilizers
3 min read
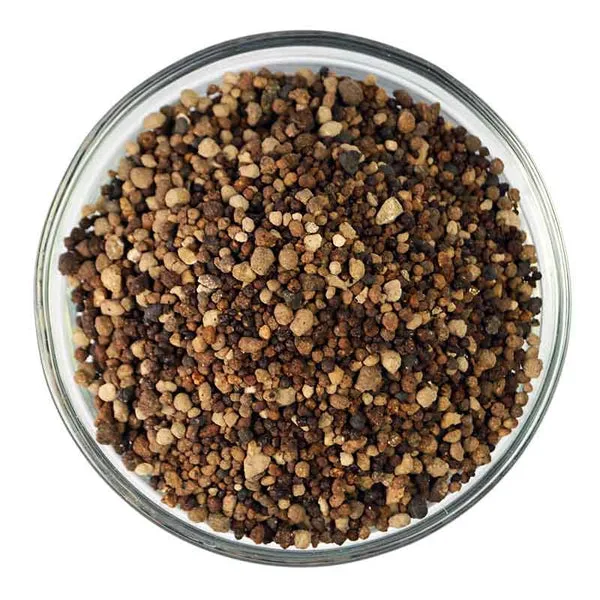
When developing elements of cultivar agrotechnology, it is important to know precisely how a specific crop reacts to the level of mineral nutrition. Some cultivars compensate for high fertilizer rates with maximum yield, while others show a weak response, which makes excess application economically unprofitable. To assess this response in practice, the method of calculating the responsiveness index (R) is used.
Responsiveness can be assessed using any significant biometric and quantitative plant traits:
- growth and development dynamics of plants;
- indicators of vegetative mass (leaf surface area, tillering);
- yield structure (plant height, number of nodes and internodes, node diameter and internode length, length of spike or panicle, number of spikelets and grains per spike, grain weight per spike or plant, 1000-grain weight).
Test Methodology and Responsiveness Index Calculation
To determine a cultivar's response to fertilizer, trials are set up using the following algorithm:
- Select two or three fertilizer application rates for comparison. For example, for rice, one can take an optimal (low) rate of N24P12K12 and an increased (high) rate of N48P24K24 g of active ingredient per 100 g of soil.
- Set up the experiment under field conditions, in lysimeters, or in vegetation pots with three replications.
- Perform the entire cycle of work: from precise fertilizer application and sowing to harvesting followed by biometric analysis of key traits.
- Conduct statistical data processing for each cultivar and experimental variant by determining the arithmetic mean (x) and the standard error to calculate the significance of differences using Student's t-test.
- Calculate the responsiveness index (R) as the ratio of the trait value on the high nutrition background to its value on the low background.
To interpret the results obtained, a cultivar responsiveness scale is used:
- Weak responsiveness for a specific trait — R = 1.40
- Moderate responsiveness — R = 1.41–1.80
- High responsiveness — R = 1.81 and above
Important: the responsiveness index calculation is only meaningful if there is a statistically significant difference between variants. If the actual value of the Student's t-test is less than the table value (tfact < ttable), the differences between nutrition backgrounds are not significant and are caused by random factors.
The table below presents the results of the evaluation of three rice cultivars on two nutrition backgrounds. Their example demonstrates how plant reaction differs when increasing the fertilizer dose.
| Cultivar | Fertilizer rate, g a.i. per 100 g of soil | Plant height, cm | Length of main panicle, cm | Number of spikelets per main panicle, units | |||
|---|---|---|---|---|---|---|---|
| x | t | x | t | x | t | ||
| Rapan | N48P24K24 | 98.7 | 6.39 | 17.3 | 4.59 | 136.0 | 1.28 |
| N24P12K12 | 88.4 | 15.6 | 125.9 | ||||
| Druzhny | N48P24K24 | 102.4 | 6.05 | 15.1 | 1.32 | 161.5 | 5.89 |
| N24P12K12 | 88.0 | 14.4 | 109.5 | ||||
| Liman | N48P24K24 | 91.4 | 9.74 | 14.7 | 9.37 | 130.1 | 7.15 |
| N24P12K12 | 76.4 | 11.7 | 86.6 | ||||
*Note: ttable = 2.09. x — arithmetic mean; t — actual value of Student's t-test.
Example of calculating the index for the Rapan cultivar based on the number of spikelets on the main panicle: divide the value on the high background (136.0) by the value on the low background (125.9). The responsiveness index R = 1.08. In this case, tfact (1.28) < ttable (2.09), meaning the difference for this trait in the Rapan cultivar is not mathematically proven.
Analyzing the obtained data allows the agronomist to precisely select elements of cultivar agrotechnology. Cultivars with proven high responsiveness to fertilizers (for example, Liman for all key traits) should be placed on a high agro-background. Cultivars with a weak response are better used with moderate doses of mineral nutrition. These data also serve as a guide for breeders when selecting parental pairs for hybridization.
Read next
Agrochemistry For students
Methodology of conducting and variance analysis of a two-factor field experiment with rice
Agrochemistry For students
Analysis of variance of the results of a single-factor field experiment with rice
Agrochemistry For students